
How Iraq can transform associated gas into electricity, by 2030
How Iraq can transform associated gas into electricity,
by 2030
Ahmad Zainy Al-Yasry
GLOBAL FLARING: 167 bcm – 2025, highest since 2019
IRAQ FLARING: 18.18 bcm – 2024 documented baseline
MARKETED GAS: 11.073 bcm – Iraq, 2024
GAS PARADOX: 164% – flared gas vs marketed gas
Associated gas flaring is no longer a marginal environmental issue, nor merely an operational problem inside oil fields. The latest global figures show that flaring has become a file of energy security, finance, emissions, and oil reputation. In 2025, global flaring rose to 167 bcm, the highest level since 2019, with a 16% increase compared with 2012. This wasted gas represents an energy resource close to the gas consumption of the African continent. In 2025, the world flared about 167 bcm of gas, a quantity larger than the volume of marketed gas crossing the Strait of Hormuz into global markets. This shows that reducing flaring is not only an environmental issue; it is an energy security issue.
The paradox increases when the World Bank’s Global Gas Flaring Tracker Report 2026 indicates that countries such as Iraq, Egypt and India import gas or energy from abroad while, at the same time, they flare large quantities of associated gas within their own territories. For Iraq, this means that part of the solution exists inside the country itself: if associated gas is captured, processed and connected to power plants and industry, imports can be reduced, pressure on the dollar can be eased, and national energy security can be strengthened.
Iraq possesses large proven natural gas reserves, and it produces oil in large quantities that generate associated gas. However, it does not convert enough of this gas into electricity, industry, or a market. According to the Oxford Institute for Energy Studies series based on the Global Gas Flaring Tracker Report 2026, Iraq’s gas flaring reached about 18.18 bcm in 2024, compared with 12.70 bcm in 2012; that is an increase of 5.48 bcm, or about 43%, over 12 years.
The most important Iraqi paradox is that the gas flared in 2024 was larger than the gas actually marketed. According to figures from the OPEC Annual Statistical Bulletin 2025, and as shown in OPEC’s natural gas tables in Section 9 of the bulletin, Iraq had proven natural gas reserves and marketed gas production. Iraq’s marketed gas production in 2024 reached about 11.073 bcm, while flaring reached 18.18 bcm. This means that the flared gas equals approximately 164% of marketed gas. This reveals that the problem is not scarcity of the resource, but weak conversion of the resource into energy, market, and industry.
Central message of the report: Associated gas in Iraq is not only an environmental or electricity file. It is a sovereign bridge between oil, the budget, electricity, the dollar, and industry. Every delay in capturing it means that Iraq burns local gas and then pays in dollars to buy its substitute from abroad or to compensate for the energy shortage.
1 Global Picture of Associated Gas Flaring
The global problem is large, concentrated, and increasingly linked to energy security rather than only emissions.
1.1 Global flaring increased instead of declining
According to the Global Gas Flaring Tracker Report 2026, global flaring reached about 167 bcm in 2025. This is the highest level since 2019 and represents an increase of 23 bcm compared with 2012. More importantly, about 10 bcm of this increase occurred in 2025 alone, which means that the problem did not retreat despite international commitments to reduce flaring. Flaring intensity also increased by about 3% in 2025, meaning the amount of gas flared per barrel of oil produced.
Global flaring rose despite commitments
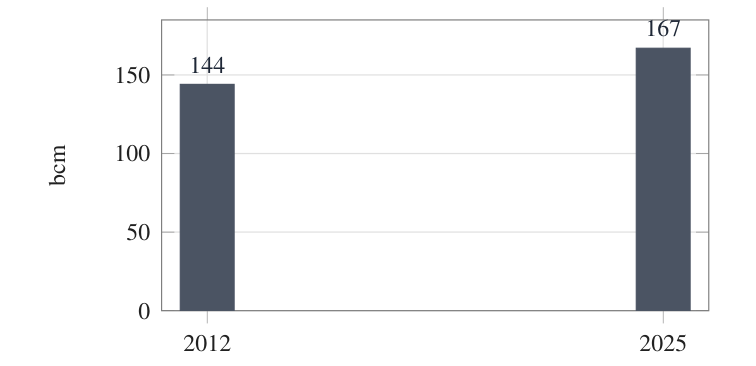
Figure 1: Global gas flaring, 2012 and 2025
Economic scale of routine flaring abatement
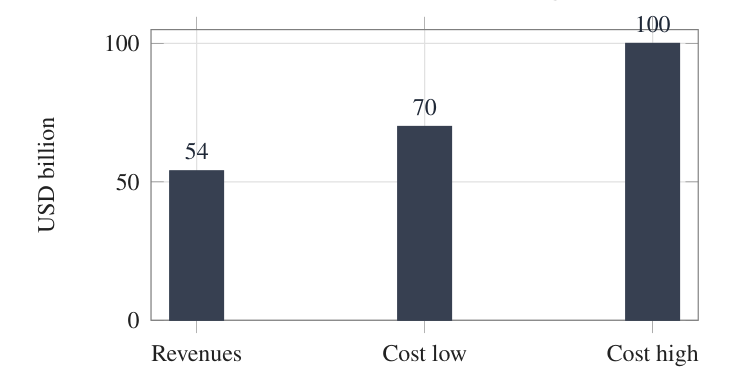
Figure 2: Potential revenues and estimated upfront spending
Reference: World Bank / GFMR, Global Gas Flaring Tracker Report 2026.
Table 1: Global flaring indicators
| Global indicator | Number | Significance |
|---|---|---|
| Global flaring in 2025 | 167 bcm | Highest level since 2019 |
| Increase compared with 2012 | 23 bcm | 16% increase |
| Increase in 2025 alone | 10 bcm | Almost half of the increase since 2012 |
| Change in flaring intensity in 2025 | Approximately +3% | Oil production alone does not explain the increase in flaring |
| Value of revenues from ending routine flaring globally | USD 54 billion | Flaring is a wasted economic resource |
| Estimated cost of global reduction | USD 70-100 billion | Finance and implementation are the main obstacle |
Reference: World Bank / GFMR, Global Gas Flaring Tracker Report 2026.
The World Bank report explains that the use of associated gas can support energy security, electricity, and clean cooking, and that LPG can be produced from associated gas to serve households and small industry. It also estimates that the possible revenues from ending routine flaring globally amount to USD 54 billion, against an estimated initial investment need of about USD 70-100 billion. This means that the problem is not only technical; the technology exists, but the core obstacles are weak regulation, lack of capital, absence of guaranteed gas markets, and weak prioritization of the flaring file as an operational and sovereign priority.
1.2 The problem is concentrated in a small number of countries
The GFMR 2026 report shows that only nine countries account for about 83% of global flaring in 2025. These countries are Russia, Iran, Iraq, Venezuela, Mexico, Libya, Algeria, Nigeria, and the United States. In contrast, the remaining more than 90 countries account for only 17% of global flaring, although they account for 54% of global oil production. This means that oil production does not necessarily require high flaring. There are large producing countries that have been able to produce oil with relatively low flaring levels, such as Saudi Arabia, Norway, and Kazakhstan.
Flaring is more concentrated than oil production
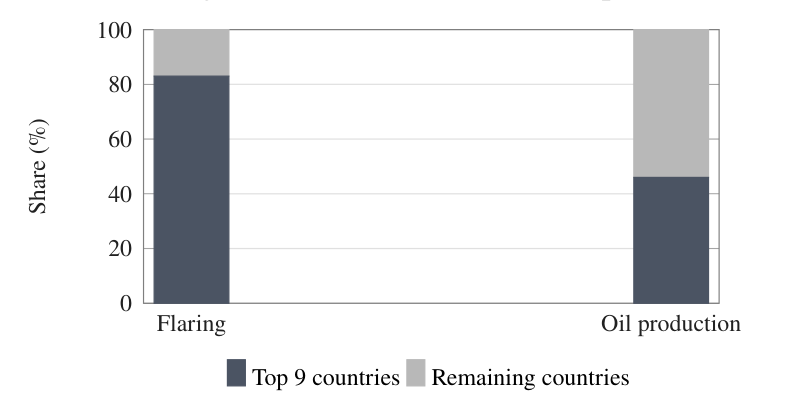
Why this matters for Iraq: Iraq is inside the first group. Therefore, any credible Iraqi reduction is not only a domestic gain; it also affects the global flaring indicator and the future carbon reputation of Iraqi oil.
Figure 3: Share of top 9 countries vs remaining countries
Reference: World Bank / GFMR, Global Gas Flaring Tracker Report 2026.
Table 2: Concentration of global flaring
| Group | Share of global flaring 2025 | Share of global oil production | Significance |
|---|---|---|---|
| Top 9 flaring countries | 83% | Approximately 46% | The problem is concentrated and not globally equal |
| Remaining 90+ countries | 17% | 54% | Oil can be produced with low flaring |
| Iraq within the first group | Yes | Large oil producer | Any Iraqi reduction has global and local impact |
Reference: World Bank / GFMR, Global Gas Flaring Tracker Report 2026.
This point is important for Iraq because reducing Iraqi flaring will not merely be a national improvement; it will be influential in the global indicator itself. Iraq is not a small case; it is one of the centers of the global problem.
1.3 Commitments to reduce flaring by 2030 are not sufficient without implementation
The Zero Routine Flaring by 2030 initiative, launched by the World Bank and the United Nations in 2015, aims to end routine flaring by the end of this decade. In the GFMR 2025 report, the initiative included 36 governments and 60 oil and gas companies, together representing about 60% of global flaring in 2024. However, the report itself states that the signatory governments and companies are still far from the required path, and that reaching the 2030 target requires very large annual reductions. It even indicates a need of about 40% annually among the committed group in order to reach the target within the remaining time.
The report also states that some signatory countries achieved good reductions, but this progress was offset by increases in major flaring countries, including Iraq, Russia, and Mexico, which together recorded an increase of about 12 bcm since 2012 within the committed group.
2 The Global LNG Market and Why It Increases the Importance of Local Gas
LNG provides flexibility, but it is not a low-risk permanent substitute for domestic associated gas.
2.1 LNG is not always a comfortable alternative
The IGU World LNG Report 2026 shows that global liquefied natural gas trade reached about 436.98 million tonnes in 2025, an increase of 6.3% from 2024. The largest exporters were the United States with 110.74 million tonnes, Qatar with 81.51 million tonnes, and Australia with 80.32 million tonnes. Europe also increased its imports of LNG by about 26.1 million tonnes to 126.2 million tonnes, while Asia remained a key center of global demand.
Top LNG exporters in 2025
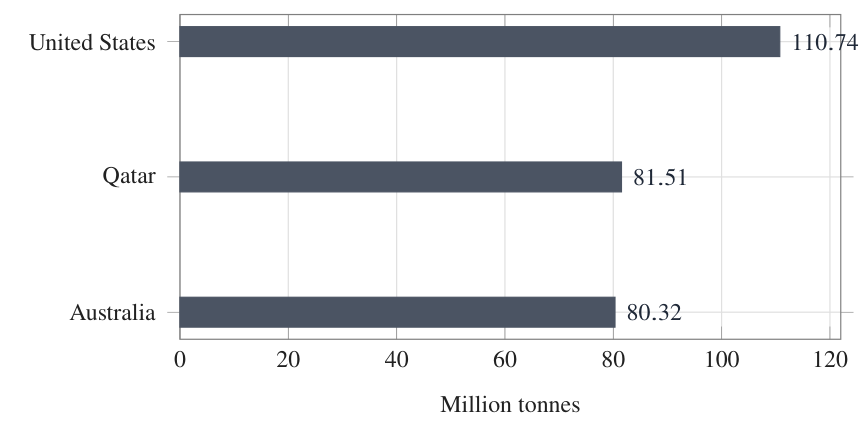
Figure 4: Largest LNG exporters in 2025
Europe pull matters
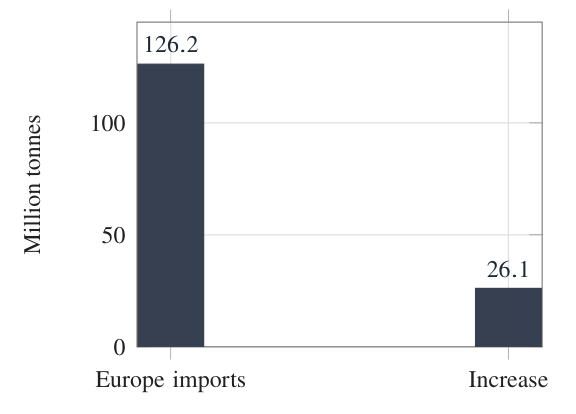
Figure 5: Europe’s LNG import profile
Reference: International Gas Union, World LNG Report 2026.
Table 3: Selected LNG market indicators in 2025
| Indicator | Number |
|---|---|
| Global LNG trade in 2025 | 436.98 million tonnes |
| Growth rate from 2024 | 6.3% |
| United States exports | 110.74 million tonnes |
| Qatar exports | 81.51 million tonnes |
| Australia exports | 80.32 million tonnes |
| Europe imports | 126.2 million tonnes |
| Increase in Europe imports | +26.1 million tonnes |
Reference: International Gas Union, World LNG Report 2026.
This is important for Iraq because LNG is a global market in which Asia and Europe compete. It is not a guaranteed-price source. Therefore, LNG or FSRU should not be allowed to become a permanent substitute for local associated gas. Yes, LNG can be an insurance policy, seasonal or emergency-based, especially during the summer peak or when external supplies are interrupted. However, it is not the foundation of energy sovereignty.
2.2 The Hormuz crisis and shipping reveal the fragility of dependence on the global market
The IGU report shows that the LNG shipping market was strongly affected in 2026 because of the Hormuz crisis. Spot shipping rates east of Suez rose from about USD 14,250/day in early February to a peak of USD 300,000/day on 5 March, then declined but remained close to USD 100,000/day in late April.
LNG shipping rates east of Suez spiked during the Hormuz crisis
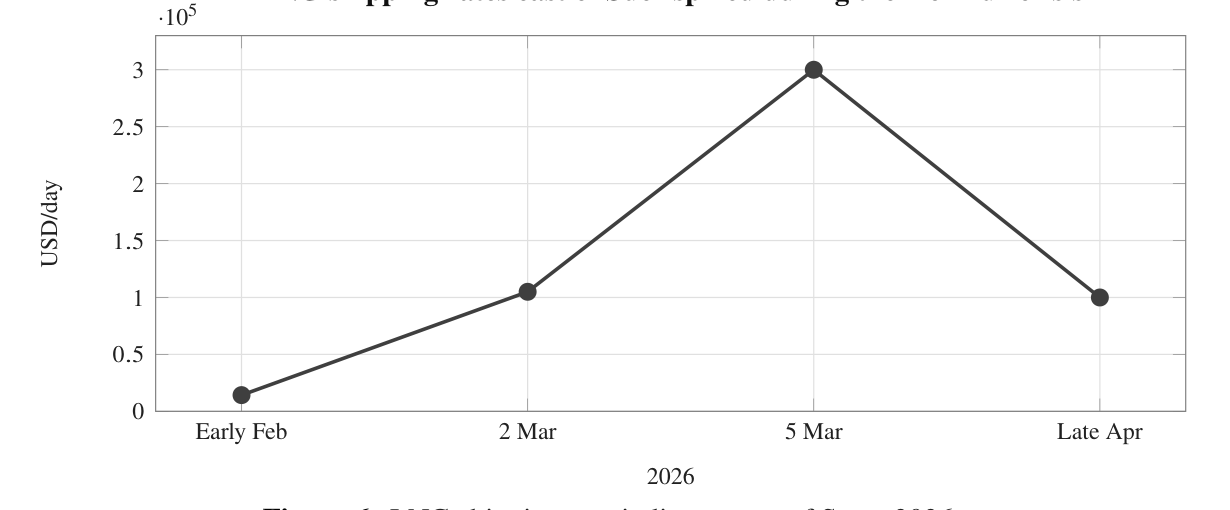
Figure 6: LNG shipping rate indicator east of Suez, 2026
Reference: International Gas Union, World LNG Report 2026.
Table 4: LNG shipping rate indicator east of Suez in 2026
| LNG shipping rate indicator east of Suez 2026 | Number |
|---|---|
| Early February | USD 14,250/day |
| 2 March | USD 105,000/day |
| 5 March | USD 300,000/day |
| Late April | Approximately USD 100,000/day |
Reference: International Gas Union, World LNG Report 2026.
Importing liquefied natural gas LNG does not mean that Iraq pays only the gas price announced in the market. The true cost includes more than one component: the price of the gas itself, shipping costs, insurance, delay risks, the cost of unloading and regasifying the gas from liquid into gas, and then the cost of transporting it inside Iraq to power plants or factories. Therefore, LNG may appear to be a fast solution, but it becomes expensive if it turns into permanent dependence.
For this reason, the correct rule for Iraq is this: liquefied natural gas is used as a reserve solution when needed, such as the summer peak, emergencies, or interruption of supplies. The basic foundation, however, should be Iraqi associated gas, because it is a local resource that already exists and is burned in the fields. If we capture it, process it, and connect it to electricity and industry, we reduce imports, protect the dollar, and strengthen energy security inside the country.
2.3 Iraq is also mentioned within emerging import markets
The IGU report indicates that several emerging markets, including Iraq, are developing their first LNG import terminals. It also states that floating infrastructure – Floating Storage and Regasification Unit (a floating unit for storing liquefied natural gas and returning it to its gaseous state) – has become a common option because it is faster and less costly than land-based terminals. The report also states that global capacity to convert liquefied natural gas from the liquid state to the gaseous state reached about 1,113.5 million tonnes per year at the end of 2025 across 50 markets, and that many new projects are under construction globally.
Here the Iraqi paradox appears: Iraq may appear as an importer of LNG at the same time as it flares large quantities of associated gas. Therefore, any Iraqi FSRU must be treated as a reserve tool, not as a substitute for capturing local gas.
3 Iraq within the Global Figures
Iraq is not a marginal case in the global flaring problem; it is one of its major centers.
3.1 Iraq is among the major global flarers
The Oxford Institute for Energy Studies shows that nine countries, including Iraq, are continuously the highest flaring countries, and that flaring in these countries rose from 93 bcm in 2012 to 115 bcm in 2024. Their share of global flaring rose from 65% to 76% over the same period, while their share of oil production increased only from 44% to 47%. This means that the increase in flaring is greater than merely the increase in oil production. According to the OIES table based on GFMR, Iraq’s flaring was as follows:
Iraq flaring stabilized at a high plateau after 2016
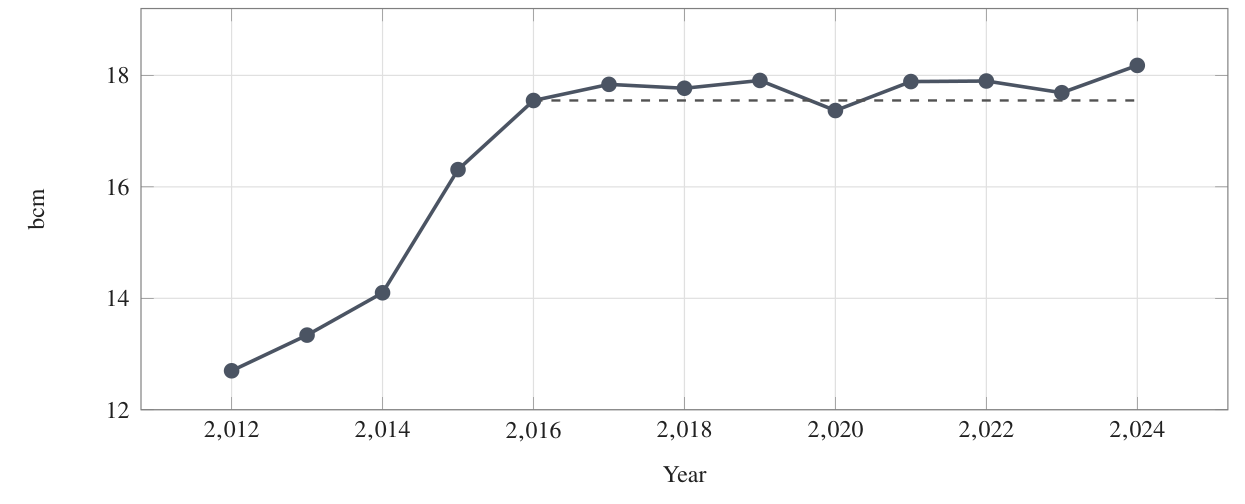
Figure 7: Iraq gas flaring trend, 2012-2024
Reference: Oxford Institute for Energy Studies, NG 204, 2026, based on GFMR data.
Table 5: Iraq gas flaring, 2012-2024
| Year | Iraq flaring / bcm | Year | Iraq flaring / bcm |
|---|---|---|---|
| 2012 | 12.70 | 2019 | 17.91 |
| 2013 | 13.34 | 2020 | 17.37 |
| 2014 | 14.10 | 2021 | 17.89 |
| 2015 | 16.31 | 2022 | 17.90 |
| 2016 | 17.55 | 2023 | 17.69 |
| 2017 | 17.84 | 2024 | 18.18 |
| 2018 | 17.77 |
Reference: Oxford Institute for Energy Studies, NG 204, 2026, based on GFMR data.
The conclusion from the table is that Iraq moved from 12.70 bcm in 2012 to 18.18 bcm in 2024. After 2016, the problem was no longer a large annual jump as much as it became stability at a very high level. In other words, the Iraqi oil system adapted to a flaring level close to 18 bcm annually.
3.2 Comparison between Iraq and the world
Table 6: Iraq and the global flaring context
| Indicator | Number |
|---|---|
| Global flaring in 2025 | 167 bcm |
| Flaring of the top 9 countries in 2025 | 83% of total |
| Iraq flaring in 2024 | 18.18 bcm |
| Iraq’s approximate share of 2025 global flaring if compared with the 2024 number | About 10.9% |
| Increase in Iraq flaring 2012-2024 | +5.48 bcm |
| Percentage increase in Iraq flaring 2012-2024 | About 43% |
Reference: World Bank / GFMR 2026; Oxford Institute for Energy Studies, NG 204, 2026.
This comparison does not mean that Iraq’s number for 2025 is the same as the 2024 number. It only explains the size of Iraq within the global problem. Even by using the documented 2024 number, Iraq represents a very large share of global flaring.
4 Iraq: What Do These Numbers Mean?
The core issue is not the existence of gas. It is the incomplete conversion of gas into usable value.
4.1 Iraq does not suffer from gas scarcity, but from weak conversion into value
According to the OPEC Annual Statistical Bulletin 2025, Iraq’s proven natural gas reserves in 2024 reached about 3,714 bcm, which is approximately 3.7 trillion cubic meters. This number represents the gas stock that is commercially recoverable according to the definition of proven reserves, and it does not represent annual production. Iraq produced only 11.073 bcm of marketed gas, while according to the GFMR/OIES series it flared about 18.18 bcm. This means that the flared gas in one year equals approximately 164% of marketed Iraqi gas in the same year. This reveals that the problem is not scarcity of the resource, but weak conversion of the resource into energy, market, and industry. To simplify it, we present it in the following table:
Iraq flared more gas than it marketed
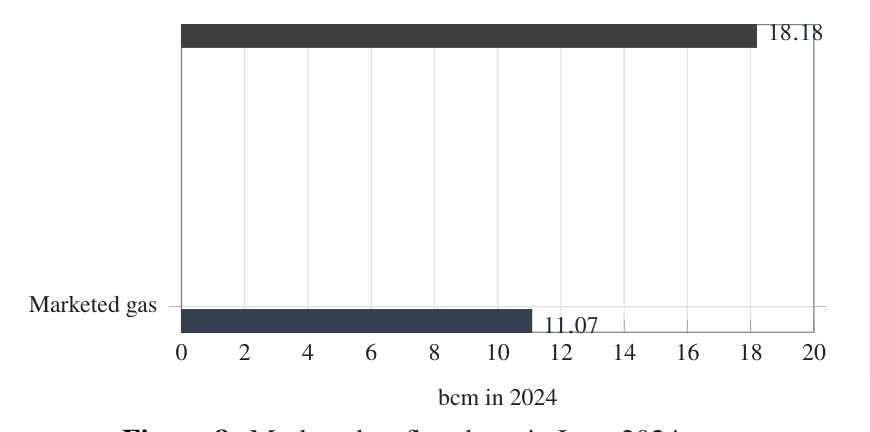
Simple reading: For every 100 units of gas Iraq marketed, it flared about 164 units. The issue is therefore not the absence of gas, but the incomplete chain for gathering, processing, transport, and market delivery.
Figure 8: Marketed vs flared gas in Iraq, 2024
Reference: OPEC Annual Statistical Bulletin 2025; Oxford Institute for Energy Studies, NG 204, 2026.
Table 7: Three different gas numbers for Iraq
| Number | Meaning | Reading |
|---|---|---|
| 3,714 bcm | Proven gas reserve | Stock underground |
| 11.073 bcm | Marketed gas in 2024 | Gas that reached use / market |
| 18.18 bcm | Gas flared in 2024 | Gas that came out with oil and was not invested |
| 18.18 / 11.073 | 1.64 | Flared gas equals 164% of marketed gas |
Reference: OPEC Annual Statistical Bulletin 2025; Oxford Institute for Energy Studies, NG 204, 2026.
In simpler terms, if Iraq markets 100 units of gas, it burns, in return, about 164 units of gas. This does not mean that all flared gas can be immediately converted into a market, because part of it needs processing, compressors, pipelines, connection, and buyers. However, it proves that the issue is not the absence of gas, but the incompleteness of the chain for gathering, processing, and marketing it.
4.2 Numerical conversions for Iraq’s 2024 flaring
Based on the baseline of 18.18 bcm in 2024, the approximate conversions are as follows:
Table 8: Numerical conversions for Iraq’s 2024 flaring
| Item | Approximate number |
|---|---|
| Annual flaring | 18.18 bcm |
| Daily flaring | 49.8 million m3/day |
| Equivalent in cubic feet | 1.76 billion cubic feet/day |
| Energy content | About 655 million MMBtu annually |
| Theoretical value at USD 4.20/MMBtu | About USD 2.75 billion |
| Theoretical value at USD 12.16/MMBtu | About USD 7.96 billion |
| Theoretical value at USD 13.8/MMBtu | About USD 9.04 billion |
| Theoretical electricity at 50% efficiency | About 11.2 GW continuous |
Reference: Calculated from the 18.18 bcm baseline; price references from local gas and international benchmark assumptions discussed in the report.
Theoretical value of the 18.18 bcm flaring baseline under different price assumptions
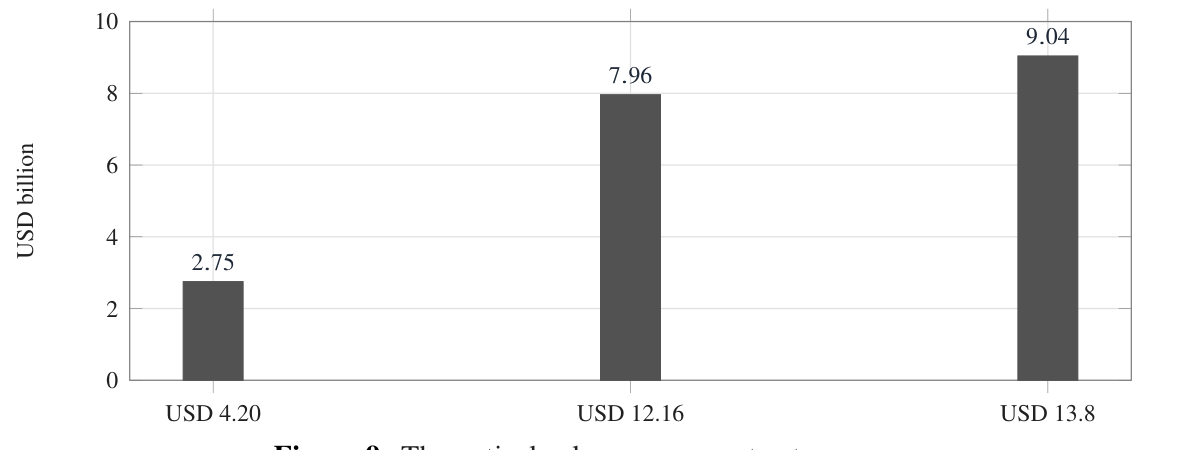
Figure 9: Theoretical value ranges – not net revenues
Reference: Calculated from the 18.18 bcm baseline.
These figures are not net revenues, and they do not mean that Iraq can tomorrow convert all flaring into electricity or profits. But they mean that the burned resource is not marginal; rather, it is equivalent to a large energy and industrial system.
Table 9: Baseline summary
| Indicator | Adopted baseline |
|---|---|
| Gas flaring – bcm/year | 18.18 |
| Million m3/day | 49.8 |
| Billion cubic feet/day | 1.76 |
| Energy – million MMBtu | 655 |
| Theoretical value at USD 4.20/MMBtu | USD 2.75 billion |
| Theoretical value at USD 13.8/MMBtu | USD 9.04 billion |
| Theoretical electricity at 50% efficiency | 11.2 GW |
5 Impact of Associated Gas on Electricity, the Dollar, and Industry
Associated gas sits at the intersection of electricity reliability, fiscal pressure, and industrial diversification.
Associated gas is the shortest bridge between oil production and electricity stability. At the baseline of 18.18 bcm, the theoretical energy is equivalent to about 11.2 GW continuous at combined-cycle efficiency of 50%, before losses from gathering, processing, transportation, and outages. This does not mean that the entire quantity will turn into electricity. It means, however, that solving a significant part of flaring can create a tangible effect on electricity supply.
In 2024, Iraq achieved oil exports of about USD 100.972 billion, while its imports of goods and services reached USD 90.379 billion. Therefore, reducing imports of gas, electricity or fuel through capturing local gas is not only an energy file. It is also a balance-of-payments and dollar file.
Iraq’s external balance is sensitive to import substitution
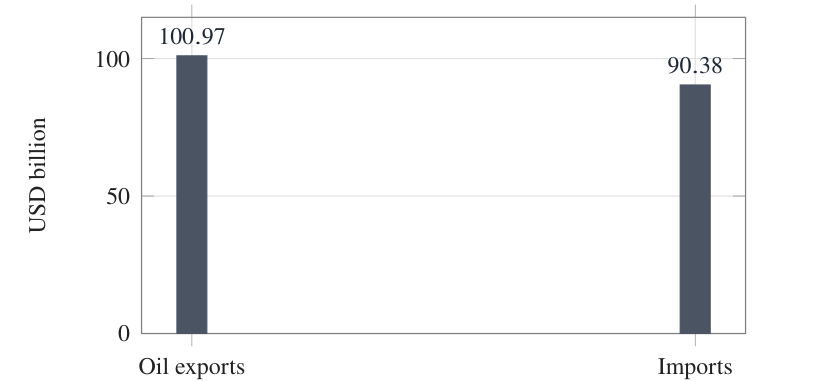
Policy implication: Every billion dollars Iraq saves from energy or fuel imports reduces pressure on the dollar and on the budget. Therefore, associated gas should enter financial stability policy, not only electricity policy.
Figure 10: Selected external-sector indicators, 2024
Reference: OPEC Annual Statistical Bulletin 2025.
Table 10: Selected Iraqi financial indicators in 2024
| Iraqi financial indicator 2024 | Number |
|---|---|
| Oil exports | USD 100.972 billion |
| Goods and services imports | USD 90.379 billion |
| Nominal GDP | USD 279.641 billion |
| Population | 46.119 million people |
Reference: OPEC Annual Statistical Bulletin 2025.
Every billion dollars Iraq saves from energy or fuel imports reduces pressure on the dollar and on the budget. Therefore, associated gas should be included within financial stability policy, not only within electricity policy.
Gas should not all go to electricity. After processing, it can be used to produce LPG and NGL, and to supply fertilizer, petrochemical, cement, brick, glass and food industries. The GFMR 2026 report confirms that associated gas can support electricity and clean cooking, and that LPG produced from associated gas serves households and small industry.
Table 11: Potential uses of associated gas in Iraq
| Use | Priority | Reason of importance for Iraq |
|---|---|---|
| Electricity | Urgent | Reducing outages and supporting Iraq’s summer |
| Replacing liquid fuel | High | Reducing operating cost or freeing products for export |
| LPG/NGL | High | Commercial value and local market |
| Fertilizers | Strategic | Food security and agricultural inputs |
| Petrochemicals | Strategic | Added value and non-oil exports |
| Reinjection | Technical / oil-related | Supporting reservoirs and reducing flaring when a nearby market is absent |
| LNG/FSRU | Reserve only | Summer peak and emergencies, not a permanent base |
Reference: World Bank / GFMR 2026; policy analysis in this report.
6 Current Projects and the Implementation Gap
Iraq does not start from zero. The real challenge is to measure delivered gas, not only design capacity.
Iraq does not start from zero. The Basrah Gas Company experience is important, and IFC financing for it is evidence that flaring-reduction projects are financeable if they have an operating company, cash flows, contracts, and measurement. The GFMR 2025 report states that IFC financing for Basrah Gas Company reached USD 360 million, distributed as USD 137.76 million from IFC’s own account, USD 180 million through participation by 8 international banks, and USD 42.24 million through the Managed Co-Lending Portfolio Program. The project is also expected to reduce about 10 million tonnes CO2e annually.
However, the problem is not only the existence of projects. The problem is the difference between design capacity and gas actually delivered. Therefore, success should not be measured by the number of projects or by nominal capacity only. Five monthly numbers must be measured:
Table 12: Five monthly questions to measure project performance
| Question | Why is it important? |
|---|---|
| 1. How much was flaring before the project? | To define the baseline |
| 2. How much did it become after the project? | To measure real reduction |
| 3. How much gas entered processing? | To know plant operation |
| 4. How much actually reached electricity or industry? | To measure economic value |
| 5. How much imported fuel or gas was displaced? | To measure the dollar and budget impact |
7 MARS, Satellites, and the Control Ledger
The next step is not another narrative strategy, but a monthly measurement system that converts alerts and field data into decisions.
The IEA/UNEP report on the Methane Alert and Response System – MARS explains that the system was launched in 2023 to provide free alerts to governments and companies on major methane emission events using satellites and artificial intelligence. However, it states that the global response rate in 2025 was only about 12%. This means that the presence of an alert alone is not enough. What is required is a government body that receives the alert and turns it into action. The proposed Iraqi protocol is:

Figure 11: Proposed Iraqi protocol for MARS alerts
Reference: IEA/UNEP, Responding to Satellite Notifications from MARS.
Table 13: Proposed Iraqi protocol for MARS alerts
| Step | Procedure |
|---|---|
| 1 | Receive and classify the alert |
| 2 | Notify the operator within a specified period |
| 3 | The operator responds technically and operationally |
| 4 | Verify through satellites or inspection |
| 5 | Document the event in a national database |
Reference: IEA/UNEP, Responding to Satellite Notifications from MARS.
Proposed national control ledger
The GFMR 2025 report explains that not knowing where and how much gas is being flared makes prioritization difficult and weakens commercial and climate finance, because finance needs a documented baseline and verifiable performance. Correct measurement also enables the state to impose fees, taxes, or fines on the basis of actual volumes rather than estimates. Therefore, we propose establishing a national control ledger for associated gas for each field, updated monthly:
Table 14: Proposed monthly associated gas control ledger
| Item | What must be measured |
|---|---|
| Produced gas | By field and operator |
| Captured gas | At the gathering point |
| Gas entering processing | At the plant gate |
| Delivered dry gas | To electricity or industry |
| Produced LPG/NGL | Quantities and value |
| Flared gas | Routine, safety, non-routine |
| Reasons for stoppage | Compressor, pipeline, plant, buyer |
| Satellite reading | Independent verification |
| Emissions | CO2 and methane |
| Financial impact | Fuel substituted, imports reduced, value added |
Reference: World Bank / GFMR 2025; IEA/UNEP MARS guidance; policy proposal in this report.
The recommended policy shift is from project announcements to measured gas delivery and a binding gas-before-oil rule.
- Adopt the number 18.18 bcm in 2024 as a temporary official baseline for the government report.
- Adopt the following explanatory comparison in the report: flared gas in Iraq equals about 164% of marketed gas, according to a comparison of 18.18 bcm flared with 11.073 bcm marketed gas.
- Establish a national control ledger for associated gas that links field, plant, electricity, and satellite data.
- Set a clear government condition: no oil expansion without a gas pathway that is financed and linked to a buyer.
- Make LNG/FSRU a seasonal and emergency reserve, not a permanent substitute for local associated gas.
- Use the Basrah Gas Company model and IFC financing as a practical reference, especially as the loan amounted to USD 360 million and is expected to reduce about 10 million tonnes CO2e annually.
- Establish a national protocol for responding to MARS alerts.
- Link the associated gas file to Iraq’s economic vision: stable electricity, reduced dollar demand, local industry, and reduced carbon intensity of Iraqi oil.
In the end, we wish to clarify that Iraq does not lack gas. Rather, it lacks a system that transforms associated gas from a flame into value. The documented number of 18.18 bcm in 2024 is not only an environmental number. It equals a daily resource of 49.8 million m3, a local theoretical value of about USD 2.75 billion annually, and a theoretical electricity capacity exceeding 11 GW before losses. In a country that depends decisively on oil for public revenues, and faces a shortage in electricity as well as pressure on imports and the dollar, capturing associated gas becomes one of the fastest paths to energy and financial sovereignty. The required decision is not merely the announcement of a new project, but changing the rule of work:
Oil does not expand alone, and gas does not remain subordinate.
Every additional barrel of oil must carry with it a clear gas pathway, financed, measured, and connected to electricity or industry.
References Adopted in the Report
| Reference | Use in the report |
|---|---|
| World Bank / GFMR, Global Gas Flaring Tracker Report 2026 | Global flaring figures for 2025, economic value, and concentration of flaring in major countries |
| Oxford Institute for Energy Studies, NG 204, 2026 | Iraq series 2012-2024 and analysis of the reasons for the persistence of flaring |
| World Bank / GFMR, Global Gas Flaring Tracker Report 2025 | Measurement methodology, ZRF 2030, financing, Basrah Gas Company model, and methane risks |
| International Gas Union, World LNG Report 2026 | LNG trade, prices, shipping, import terminals, and the effect of Hormuz |
| OPEC, Annual Statistical Bulletin 2025 | Iraq’s basic economic, oil and gas figures |
| IEA/UNEP, Responding to Satellite Notifications from MARS | Protocol for responding to methane alerts |
| BTI, Iraq 2026 | Economic and financial background, electricity, and oil dependence |
Share This Article!
Disclaimer:
The views and opinions expressed in the article are solely those of the author(s) and do not necessarily reflect Direct Policy Foundation’s position.
Text Copyright: We allow sharing of links to our published content (otherwise protected by intellectual property rights) on the condition that the content is not copied, wholly or partially, republished elsewhere, or reproduced in any form without prior consent of the Direct Policy Foundation.
Image Copyright: All images used, unless credited otherwise, are AI-generated by the Direct Policy Foundation's editorial team, and may not be copied or used outside this website without prior written consent. All rights reserved © 2026 Direct Policy Foundation
How Iraq can transform associated gas into electricity, by 2030
How Iraq can transform associated gas into electricity,
by 2030
Ahmad Zainy Al-Yasry
GLOBAL FLARING: 167 bcm – 2025, highest since 2019
IRAQ FLARING: 18.18 bcm – 2024 documented baseline
MARKETED GAS: 11.073 bcm – Iraq, 2024
GAS PARADOX: 164% – flared gas vs marketed gas
Associated gas flaring is no longer a marginal environmental issue, nor merely an operational problem inside oil fields. The latest global figures show that flaring has become a file of energy security, finance, emissions, and oil reputation. In 2025, global flaring rose to 167 bcm, the highest level since 2019, with a 16% increase compared with 2012. This wasted gas represents an energy resource close to the gas consumption of the African continent. In 2025, the world flared about 167 bcm of gas, a quantity larger than the volume of marketed gas crossing the Strait of Hormuz into global markets. This shows that reducing flaring is not only an environmental issue; it is an energy security issue.
The paradox increases when the World Bank’s Global Gas Flaring Tracker Report 2026 indicates that countries such as Iraq, Egypt and India import gas or energy from abroad while, at the same time, they flare large quantities of associated gas within their own territories. For Iraq, this means that part of the solution exists inside the country itself: if associated gas is captured, processed and connected to power plants and industry, imports can be reduced, pressure on the dollar can be eased, and national energy security can be strengthened.
Iraq possesses large proven natural gas reserves, and it produces oil in large quantities that generate associated gas. However, it does not convert enough of this gas into electricity, industry, or a market. According to the Oxford Institute for Energy Studies series based on the Global Gas Flaring Tracker Report 2026, Iraq’s gas flaring reached about 18.18 bcm in 2024, compared with 12.70 bcm in 2012; that is an increase of 5.48 bcm, or about 43%, over 12 years.
The most important Iraqi paradox is that the gas flared in 2024 was larger than the gas actually marketed. According to figures from the OPEC Annual Statistical Bulletin 2025, and as shown in OPEC’s natural gas tables in Section 9 of the bulletin, Iraq had proven natural gas reserves and marketed gas production. Iraq’s marketed gas production in 2024 reached about 11.073 bcm, while flaring reached 18.18 bcm. This means that the flared gas equals approximately 164% of marketed gas. This reveals that the problem is not scarcity of the resource, but weak conversion of the resource into energy, market, and industry.
Central message of the report: Associated gas in Iraq is not only an environmental or electricity file. It is a sovereign bridge between oil, the budget, electricity, the dollar, and industry. Every delay in capturing it means that Iraq burns local gas and then pays in dollars to buy its substitute from abroad or to compensate for the energy shortage.
1 Global Picture of Associated Gas Flaring
The global problem is large, concentrated, and increasingly linked to energy security rather than only emissions.
1.1 Global flaring increased instead of declining
According to the Global Gas Flaring Tracker Report 2026, global flaring reached about 167 bcm in 2025. This is the highest level since 2019 and represents an increase of 23 bcm compared with 2012. More importantly, about 10 bcm of this increase occurred in 2025 alone, which means that the problem did not retreat despite international commitments to reduce flaring. Flaring intensity also increased by about 3% in 2025, meaning the amount of gas flared per barrel of oil produced.
Global flaring rose despite commitments
Figure 1: Global gas flaring, 2012 and 2025
Economic scale of routine flaring abatement
Figure 2: Potential revenues and estimated upfront spending
Reference: World Bank / GFMR, Global Gas Flaring Tracker Report 2026.
Table 1: Global flaring indicators
| Global indicator | Number | Significance |
|---|---|---|
| Global flaring in 2025 | 167 bcm | Highest level since 2019 |
| Increase compared with 2012 | 23 bcm | 16% increase |
| Increase in 2025 alone | 10 bcm | Almost half of the increase since 2012 |
| Change in flaring intensity in 2025 | Approximately +3% | Oil production alone does not explain the increase in flaring |
| Value of revenues from ending routine flaring globally | USD 54 billion | Flaring is a wasted economic resource |
| Estimated cost of global reduction | USD 70-100 billion | Finance and implementation are the main obstacle |
Reference: World Bank / GFMR, Global Gas Flaring Tracker Report 2026.
The World Bank report explains that the use of associated gas can support energy security, electricity, and clean cooking, and that LPG can be produced from associated gas to serve households and small industry. It also estimates that the possible revenues from ending routine flaring globally amount to USD 54 billion, against an estimated initial investment need of about USD 70-100 billion. This means that the problem is not only technical; the technology exists, but the core obstacles are weak regulation, lack of capital, absence of guaranteed gas markets, and weak prioritization of the flaring file as an operational and sovereign priority.
1.2 The problem is concentrated in a small number of countries
The GFMR 2026 report shows that only nine countries account for about 83% of global flaring in 2025. These countries are Russia, Iran, Iraq, Venezuela, Mexico, Libya, Algeria, Nigeria, and the United States. In contrast, the remaining more than 90 countries account for only 17% of global flaring, although they account for 54% of global oil production. This means that oil production does not necessarily require high flaring. There are large producing countries that have been able to produce oil with relatively low flaring levels, such as Saudi Arabia, Norway, and Kazakhstan.
Flaring is more concentrated than oil production
Why this matters for Iraq: Iraq is inside the first group. Therefore, any credible Iraqi reduction is not only a domestic gain; it also affects the global flaring indicator and the future carbon reputation of Iraqi oil.
Figure 3: Share of top 9 countries vs remaining countries
Reference: World Bank / GFMR, Global Gas Flaring Tracker Report 2026.
Table 2: Concentration of global flaring
| Group | Share of global flaring 2025 | Share of global oil production | Significance |
|---|---|---|---|
| Top 9 flaring countries | 83% | Approximately 46% | The problem is concentrated and not globally equal |
| Remaining 90+ countries | 17% | 54% | Oil can be produced with low flaring |
| Iraq within the first group | Yes | Large oil producer | Any Iraqi reduction has global and local impact |
Reference: World Bank / GFMR, Global Gas Flaring Tracker Report 2026.
This point is important for Iraq because reducing Iraqi flaring will not merely be a national improvement; it will be influential in the global indicator itself. Iraq is not a small case; it is one of the centers of the global problem.
1.3 Commitments to reduce flaring by 2030 are not sufficient without implementation
The Zero Routine Flaring by 2030 initiative, launched by the World Bank and the United Nations in 2015, aims to end routine flaring by the end of this decade. In the GFMR 2025 report, the initiative included 36 governments and 60 oil and gas companies, together representing about 60% of global flaring in 2024. However, the report itself states that the signatory governments and companies are still far from the required path, and that reaching the 2030 target requires very large annual reductions. It even indicates a need of about 40% annually among the committed group in order to reach the target within the remaining time.
The report also states that some signatory countries achieved good reductions, but this progress was offset by increases in major flaring countries, including Iraq, Russia, and Mexico, which together recorded an increase of about 12 bcm since 2012 within the committed group.
2 The Global LNG Market and Why It Increases the Importance of Local Gas
LNG provides flexibility, but it is not a low-risk permanent substitute for domestic associated gas.
2.1 LNG is not always a comfortable alternative
The IGU World LNG Report 2026 shows that global liquefied natural gas trade reached about 436.98 million tonnes in 2025, an increase of 6.3% from 2024. The largest exporters were the United States with 110.74 million tonnes, Qatar with 81.51 million tonnes, and Australia with 80.32 million tonnes. Europe also increased its imports of LNG by about 26.1 million tonnes to 126.2 million tonnes, while Asia remained a key center of global demand.
Top LNG exporters in 2025
Figure 4: Largest LNG exporters in 2025
Europe pull matters
Figure 5: Europe’s LNG import profile
Reference: International Gas Union, World LNG Report 2026.
Table 3: Selected LNG market indicators in 2025
| Indicator | Number |
|---|---|
| Global LNG trade in 2025 | 436.98 million tonnes |
| Growth rate from 2024 | 6.3% |
| United States exports | 110.74 million tonnes |
| Qatar exports | 81.51 million tonnes |
| Australia exports | 80.32 million tonnes |
| Europe imports | 126.2 million tonnes |
| Increase in Europe imports | +26.1 million tonnes |
Reference: International Gas Union, World LNG Report 2026.
This is important for Iraq because LNG is a global market in which Asia and Europe compete. It is not a guaranteed-price source. Therefore, LNG or FSRU should not be allowed to become a permanent substitute for local associated gas. Yes, LNG can be an insurance policy, seasonal or emergency-based, especially during the summer peak or when external supplies are interrupted. However, it is not the foundation of energy sovereignty.
2.2 The Hormuz crisis and shipping reveal the fragility of dependence on the global market
The IGU report shows that the LNG shipping market was strongly affected in 2026 because of the Hormuz crisis. Spot shipping rates east of Suez rose from about USD 14,250/day in early February to a peak of USD 300,000/day on 5 March, then declined but remained close to USD 100,000/day in late April.
LNG shipping rates east of Suez spiked during the Hormuz crisis
Figure 6: LNG shipping rate indicator east of Suez, 2026
Reference: International Gas Union, World LNG Report 2026.
Table 4: LNG shipping rate indicator east of Suez in 2026
| LNG shipping rate indicator east of Suez 2026 | Number |
|---|---|
| Early February | USD 14,250/day |
| 2 March | USD 105,000/day |
| 5 March | USD 300,000/day |
| Late April | Approximately USD 100,000/day |
Reference: International Gas Union, World LNG Report 2026.
Importing liquefied natural gas LNG does not mean that Iraq pays only the gas price announced in the market. The true cost includes more than one component: the price of the gas itself, shipping costs, insurance, delay risks, the cost of unloading and regasifying the gas from liquid into gas, and then the cost of transporting it inside Iraq to power plants or factories. Therefore, LNG may appear to be a fast solution, but it becomes expensive if it turns into permanent dependence.
For this reason, the correct rule for Iraq is this: liquefied natural gas is used as a reserve solution when needed, such as the summer peak, emergencies, or interruption of supplies. The basic foundation, however, should be Iraqi associated gas, because it is a local resource that already exists and is burned in the fields. If we capture it, process it, and connect it to electricity and industry, we reduce imports, protect the dollar, and strengthen energy security inside the country.
2.3 Iraq is also mentioned within emerging import markets
The IGU report indicates that several emerging markets, including Iraq, are developing their first LNG import terminals. It also states that floating infrastructure – Floating Storage and Regasification Unit (a floating unit for storing liquefied natural gas and returning it to its gaseous state) – has become a common option because it is faster and less costly than land-based terminals. The report also states that global capacity to convert liquefied natural gas from the liquid state to the gaseous state reached about 1,113.5 million tonnes per year at the end of 2025 across 50 markets, and that many new projects are under construction globally.
Here the Iraqi paradox appears: Iraq may appear as an importer of LNG at the same time as it flares large quantities of associated gas. Therefore, any Iraqi FSRU must be treated as a reserve tool, not as a substitute for capturing local gas.
3 Iraq within the Global Figures
Iraq is not a marginal case in the global flaring problem; it is one of its major centers.
3.1 Iraq is among the major global flarers
The Oxford Institute for Energy Studies shows that nine countries, including Iraq, are continuously the highest flaring countries, and that flaring in these countries rose from 93 bcm in 2012 to 115 bcm in 2024. Their share of global flaring rose from 65% to 76% over the same period, while their share of oil production increased only from 44% to 47%. This means that the increase in flaring is greater than merely the increase in oil production. According to the OIES table based on GFMR, Iraq’s flaring was as follows:
Iraq flaring stabilized at a high plateau after 2016
Figure 7: Iraq gas flaring trend, 2012-2024
Reference: Oxford Institute for Energy Studies, NG 204, 2026, based on GFMR data.
Table 5: Iraq gas flaring, 2012-2024
| Year | Iraq flaring / bcm | Year | Iraq flaring / bcm |
|---|---|---|---|
| 2012 | 12.70 | 2019 | 17.91 |
| 2013 | 13.34 | 2020 | 17.37 |
| 2014 | 14.10 | 2021 | 17.89 |
| 2015 | 16.31 | 2022 | 17.90 |
| 2016 | 17.55 | 2023 | 17.69 |
| 2017 | 17.84 | 2024 | 18.18 |
| 2018 | 17.77 |
Reference: Oxford Institute for Energy Studies, NG 204, 2026, based on GFMR data.
The conclusion from the table is that Iraq moved from 12.70 bcm in 2012 to 18.18 bcm in 2024. After 2016, the problem was no longer a large annual jump as much as it became stability at a very high level. In other words, the Iraqi oil system adapted to a flaring level close to 18 bcm annually.
3.2 Comparison between Iraq and the world
Table 6: Iraq and the global flaring context
| Indicator | Number |
|---|---|
| Global flaring in 2025 | 167 bcm |
| Flaring of the top 9 countries in 2025 | 83% of total |
| Iraq flaring in 2024 | 18.18 bcm |
| Iraq’s approximate share of 2025 global flaring if compared with the 2024 number | About 10.9% |
| Increase in Iraq flaring 2012-2024 | +5.48 bcm |
| Percentage increase in Iraq flaring 2012-2024 | About 43% |
Reference: World Bank / GFMR 2026; Oxford Institute for Energy Studies, NG 204, 2026.
This comparison does not mean that Iraq’s number for 2025 is the same as the 2024 number. It only explains the size of Iraq within the global problem. Even by using the documented 2024 number, Iraq represents a very large share of global flaring.
4 Iraq: What Do These Numbers Mean?
The core issue is not the existence of gas. It is the incomplete conversion of gas into usable value.
4.1 Iraq does not suffer from gas scarcity, but from weak conversion into value
According to the OPEC Annual Statistical Bulletin 2025, Iraq’s proven natural gas reserves in 2024 reached about 3,714 bcm, which is approximately 3.7 trillion cubic meters. This number represents the gas stock that is commercially recoverable according to the definition of proven reserves, and it does not represent annual production. Iraq produced only 11.073 bcm of marketed gas, while according to the GFMR/OIES series it flared about 18.18 bcm. This means that the flared gas in one year equals approximately 164% of marketed Iraqi gas in the same year. This reveals that the problem is not scarcity of the resource, but weak conversion of the resource into energy, market, and industry. To simplify it, we present it in the following table:
Iraq flared more gas than it marketed
Simple reading: For every 100 units of gas Iraq marketed, it flared about 164 units. The issue is therefore not the absence of gas, but the incomplete chain for gathering, processing, transport, and market delivery.
Figure 8: Marketed vs flared gas in Iraq, 2024
Reference: OPEC Annual Statistical Bulletin 2025; Oxford Institute for Energy Studies, NG 204, 2026.
Table 7: Three different gas numbers for Iraq
| Number | Meaning | Reading |
|---|---|---|
| 3,714 bcm | Proven gas reserve | Stock underground |
| 11.073 bcm | Marketed gas in 2024 | Gas that reached use / market |
| 18.18 bcm | Gas flared in 2024 | Gas that came out with oil and was not invested |
| 18.18 / 11.073 | 1.64 | Flared gas equals 164% of marketed gas |
Reference: OPEC Annual Statistical Bulletin 2025; Oxford Institute for Energy Studies, NG 204, 2026.
In simpler terms, if Iraq markets 100 units of gas, it burns, in return, about 164 units of gas. This does not mean that all flared gas can be immediately converted into a market, because part of it needs processing, compressors, pipelines, connection, and buyers. However, it proves that the issue is not the absence of gas, but the incompleteness of the chain for gathering, processing, and marketing it.
4.2 Numerical conversions for Iraq’s 2024 flaring
Based on the baseline of 18.18 bcm in 2024, the approximate conversions are as follows:
Table 8: Numerical conversions for Iraq’s 2024 flaring
| Item | Approximate number |
|---|---|
| Annual flaring | 18.18 bcm |
| Daily flaring | 49.8 million m3/day |
| Equivalent in cubic feet | 1.76 billion cubic feet/day |
| Energy content | About 655 million MMBtu annually |
| Theoretical value at USD 4.20/MMBtu | About USD 2.75 billion |
| Theoretical value at USD 12.16/MMBtu | About USD 7.96 billion |
| Theoretical value at USD 13.8/MMBtu | About USD 9.04 billion |
| Theoretical electricity at 50% efficiency | About 11.2 GW continuous |
Reference: Calculated from the 18.18 bcm baseline; price references from local gas and international benchmark assumptions discussed in the report.
Theoretical value of the 18.18 bcm flaring baseline under different price assumptions
Figure 9: Theoretical value ranges – not net revenues
Reference: Calculated from the 18.18 bcm baseline.
These figures are not net revenues, and they do not mean that Iraq can tomorrow convert all flaring into electricity or profits. But they mean that the burned resource is not marginal; rather, it is equivalent to a large energy and industrial system.
Table 9: Baseline summary
| Indicator | Adopted baseline |
|---|---|
| Gas flaring – bcm/year | 18.18 |
| Million m3/day | 49.8 |
| Billion cubic feet/day | 1.76 |
| Energy – million MMBtu | 655 |
| Theoretical value at USD 4.20/MMBtu | USD 2.75 billion |
| Theoretical value at USD 13.8/MMBtu | USD 9.04 billion |
| Theoretical electricity at 50% efficiency | 11.2 GW |
5 Impact of Associated Gas on Electricity, the Dollar, and Industry
Associated gas sits at the intersection of electricity reliability, fiscal pressure, and industrial diversification.
Associated gas is the shortest bridge between oil production and electricity stability. At the baseline of 18.18 bcm, the theoretical energy is equivalent to about 11.2 GW continuous at combined-cycle efficiency of 50%, before losses from gathering, processing, transportation, and outages. This does not mean that the entire quantity will turn into electricity. It means, however, that solving a significant part of flaring can create a tangible effect on electricity supply.
In 2024, Iraq achieved oil exports of about USD 100.972 billion, while its imports of goods and services reached USD 90.379 billion. Therefore, reducing imports of gas, electricity or fuel through capturing local gas is not only an energy file. It is also a balance-of-payments and dollar file.
Iraq’s external balance is sensitive to import substitution
Policy implication: Every billion dollars Iraq saves from energy or fuel imports reduces pressure on the dollar and on the budget. Therefore, associated gas should enter financial stability policy, not only electricity policy.
Figure 10: Selected external-sector indicators, 2024
Reference: OPEC Annual Statistical Bulletin 2025.
Table 10: Selected Iraqi financial indicators in 2024
| Iraqi financial indicator 2024 | Number |
|---|---|
| Oil exports | USD 100.972 billion |
| Goods and services imports | USD 90.379 billion |
| Nominal GDP | USD 279.641 billion |
| Population | 46.119 million people |
Reference: OPEC Annual Statistical Bulletin 2025.
Every billion dollars Iraq saves from energy or fuel imports reduces pressure on the dollar and on the budget. Therefore, associated gas should be included within financial stability policy, not only within electricity policy.
Gas should not all go to electricity. After processing, it can be used to produce LPG and NGL, and to supply fertilizer, petrochemical, cement, brick, glass and food industries. The GFMR 2026 report confirms that associated gas can support electricity and clean cooking, and that LPG produced from associated gas serves households and small industry.
Table 11: Potential uses of associated gas in Iraq
| Use | Priority | Reason of importance for Iraq |
|---|---|---|
| Electricity | Urgent | Reducing outages and supporting Iraq’s summer |
| Replacing liquid fuel | High | Reducing operating cost or freeing products for export |
| LPG/NGL | High | Commercial value and local market |
| Fertilizers | Strategic | Food security and agricultural inputs |
| Petrochemicals | Strategic | Added value and non-oil exports |
| Reinjection | Technical / oil-related | Supporting reservoirs and reducing flaring when a nearby market is absent |
| LNG/FSRU | Reserve only | Summer peak and emergencies, not a permanent base |
Reference: World Bank / GFMR 2026; policy analysis in this report.
6 Current Projects and the Implementation Gap
Iraq does not start from zero. The real challenge is to measure delivered gas, not only design capacity.
Iraq does not start from zero. The Basrah Gas Company experience is important, and IFC financing for it is evidence that flaring-reduction projects are financeable if they have an operating company, cash flows, contracts, and measurement. The GFMR 2025 report states that IFC financing for Basrah Gas Company reached USD 360 million, distributed as USD 137.76 million from IFC’s own account, USD 180 million through participation by 8 international banks, and USD 42.24 million through the Managed Co-Lending Portfolio Program. The project is also expected to reduce about 10 million tonnes CO2e annually.
However, the problem is not only the existence of projects. The problem is the difference between design capacity and gas actually delivered. Therefore, success should not be measured by the number of projects or by nominal capacity only. Five monthly numbers must be measured:
Table 12: Five monthly questions to measure project performance
| Question | Why is it important? |
|---|---|
| 1. How much was flaring before the project? | To define the baseline |
| 2. How much did it become after the project? | To measure real reduction |
| 3. How much gas entered processing? | To know plant operation |
| 4. How much actually reached electricity or industry? | To measure economic value |
| 5. How much imported fuel or gas was displaced? | To measure the dollar and budget impact |
7 MARS, Satellites, and the Control Ledger
The next step is not another narrative strategy, but a monthly measurement system that converts alerts and field data into decisions.
The IEA/UNEP report on the Methane Alert and Response System – MARS explains that the system was launched in 2023 to provide free alerts to governments and companies on major methane emission events using satellites and artificial intelligence. However, it states that the global response rate in 2025 was only about 12%. This means that the presence of an alert alone is not enough. What is required is a government body that receives the alert and turns it into action. The proposed Iraqi protocol is:
Figure 11: Proposed Iraqi protocol for MARS alerts
Reference: IEA/UNEP, Responding to Satellite Notifications from MARS.
Table 13: Proposed Iraqi protocol for MARS alerts
| Step | Procedure |
|---|---|
| 1 | Receive and classify the alert |
| 2 | Notify the operator within a specified period |
| 3 | The operator responds technically and operationally |
| 4 | Verify through satellites or inspection |
| 5 | Document the event in a national database |
Reference: IEA/UNEP, Responding to Satellite Notifications from MARS.
Proposed national control ledger
The GFMR 2025 report explains that not knowing where and how much gas is being flared makes prioritization difficult and weakens commercial and climate finance, because finance needs a documented baseline and verifiable performance. Correct measurement also enables the state to impose fees, taxes, or fines on the basis of actual volumes rather than estimates. Therefore, we propose establishing a national control ledger for associated gas for each field, updated monthly:
Table 14: Proposed monthly associated gas control ledger
| Item | What must be measured |
|---|---|
| Produced gas | By field and operator |
| Captured gas | At the gathering point |
| Gas entering processing | At the plant gate |
| Delivered dry gas | To electricity or industry |
| Produced LPG/NGL | Quantities and value |
| Flared gas | Routine, safety, non-routine |
| Reasons for stoppage | Compressor, pipeline, plant, buyer |
| Satellite reading | Independent verification |
| Emissions | CO2 and methane |
| Financial impact | Fuel substituted, imports reduced, value added |
Reference: World Bank / GFMR 2025; IEA/UNEP MARS guidance; policy proposal in this report.
The recommended policy shift is from project announcements to measured gas delivery and a binding gas-before-oil rule.
- Adopt the number 18.18 bcm in 2024 as a temporary official baseline for the government report.
- Adopt the following explanatory comparison in the report: flared gas in Iraq equals about 164% of marketed gas, according to a comparison of 18.18 bcm flared with 11.073 bcm marketed gas.
- Establish a national control ledger for associated gas that links field, plant, electricity, and satellite data.
- Set a clear government condition: no oil expansion without a gas pathway that is financed and linked to a buyer.
- Make LNG/FSRU a seasonal and emergency reserve, not a permanent substitute for local associated gas.
- Use the Basrah Gas Company model and IFC financing as a practical reference, especially as the loan amounted to USD 360 million and is expected to reduce about 10 million tonnes CO2e annually.
- Establish a national protocol for responding to MARS alerts.
- Link the associated gas file to Iraq’s economic vision: stable electricity, reduced dollar demand, local industry, and reduced carbon intensity of Iraqi oil.
In the end, we wish to clarify that Iraq does not lack gas. Rather, it lacks a system that transforms associated gas from a flame into value. The documented number of 18.18 bcm in 2024 is not only an environmental number. It equals a daily resource of 49.8 million m3, a local theoretical value of about USD 2.75 billion annually, and a theoretical electricity capacity exceeding 11 GW before losses. In a country that depends decisively on oil for public revenues, and faces a shortage in electricity as well as pressure on imports and the dollar, capturing associated gas becomes one of the fastest paths to energy and financial sovereignty. The required decision is not merely the announcement of a new project, but changing the rule of work:
Oil does not expand alone, and gas does not remain subordinate.
Every additional barrel of oil must carry with it a clear gas pathway, financed, measured, and connected to electricity or industry.
References Adopted in the Report
| Reference | Use in the report |
|---|---|
| World Bank / GFMR, Global Gas Flaring Tracker Report 2026 | Global flaring figures for 2025, economic value, and concentration of flaring in major countries |
| Oxford Institute for Energy Studies, NG 204, 2026 | Iraq series 2012-2024 and analysis of the reasons for the persistence of flaring |
| World Bank / GFMR, Global Gas Flaring Tracker Report 2025 | Measurement methodology, ZRF 2030, financing, Basrah Gas Company model, and methane risks |
| International Gas Union, World LNG Report 2026 | LNG trade, prices, shipping, import terminals, and the effect of Hormuz |
| OPEC, Annual Statistical Bulletin 2025 | Iraq’s basic economic, oil and gas figures |
| IEA/UNEP, Responding to Satellite Notifications from MARS | Protocol for responding to methane alerts |
| BTI, Iraq 2026 | Economic and financial background, electricity, and oil dependence |
Share This Article!
Disclaimer: The views and opinions expressed in the content are solely those of the authors and do not necessarily reflect the Direct Policy Center’s position.Copyright: We allow sharing of links to our published research articles and analyses (otherwise protected by intellectual property (rights) on the condition that their content is not copied, wholly or partially, republished elsewhere, or reproduced in any form without the prior consent of the Direct Policy Center. All rights reserved © 2025